Imports – we need to add the root path for our package
from pathlib import Path
import sys
repo_path = Path("__file__").absolute().parent.parent.resolve()
assert repo_path.exists()
sys.path.insert(0, str(repo_path))
from bioevents import event_handling, hypnogram
import matplotlib.pyplot as plt
import numpy as np
The Event class
help(event_handling.Event.__init__)
Help on function __init__ in module bioevents.event_handling:

__init__(self, on, off=None, tolerances=None)
    Container for timestamped, binary events.
    Also includes functionality for determining overlap with other events.
Define three events that happened between timestamps 20 and 100, 120 and 126, and 125 and 130, respectively
event_a = event_handling.Event(on=20, off=100)
event_b = event_handling.Event(on=120, off=126)
event_c = event_handling.Event(on=125, off=130)
Find the duration of each event
print(event_a.duration)
print(event_b.duration)
print(event_c.duration)
80
6
5
Overlap analysis
The Event object can be directly compared to another Event via the “overlaps” function. This configurable behavior will form the basis of more complex time series analyses we will do at a higher level.
help(event_handling.Event.overlaps)
Help on function overlaps in module bioevents.event_handling:

overlaps(self, other)
    Determines whether this event "overlaps" another, based on various criteria.

    Notes
    -----
    It's important to note that this overlap is not necessarily a "symmetrical" operation.
    Because the duration and tolerances of THIS event are used, self.overlaps(other) may differ
    from other.overlaps(self). This is by design, given that a "reference" or "truth" event should
    govern the acceptance criteria of "predicted" event annotations, and not the other way around.

    See Also
    --------
    OverlapTolerances
print(f"{event_a} overlaps {event_b}: {event_a.overlaps(event_b)}")
print(f"{event_b} overlaps {event_c}: {event_b.overlaps(event_c)}")
{'on': 20, 'off': 100} overlaps {'on': 120, 'off': 126}: False
{'on': 120, 'off': 126} overlaps {'on': 125, 'off': 130}: True
As noted in the docstring, the “overlaps” function is governed by the “OverlapTolerances” class. By default, any contemporaneity of one or more samples is considered a viable overlap. For example, this is consistent with "Seizure Detection", Mark L. Scheuer et al., 2021
event_a.tolerances
{'diff_off': inf, 'diff_on': inf, 'ratio_off': inf, 'ratio_on': inf}
We could be a little more strict, by dictating that the onsets of any “overlapping” Events must be within “diff_on” samples of event_b:
event_b.tolerances.diff_on = 3
print(f"{event_b} overlaps {event_c}: {event_b.overlaps(event_c)}")
{'on': 120, 'off': 126} overlaps {'on': 125, 'off': 130}: False
The EventSeries class
Import and Export
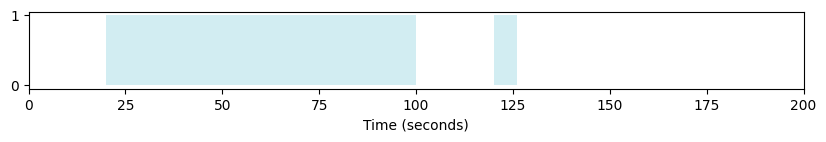
Place these events in an EventSeries, starting at timestamp 0 and ending after a duration of 200. We can immediately plot the event series.
events = event_handling.EventSeries([event_a, event_b], duration=200)
plt.subplots(figsize=(10,1))
events.plot()
We can also export our events as a Dataframe
events.as_dataframe()
| on | off | |
|---|---|---|
| 0 | 20 | 100 |
| 1 | 120 | 126 |
… or as a boolean array
events.as_bools()
array([False, False, False, False, False, False, False, False, False,
       False, False, False, False, False, False, False, False, False,
       False, False,  True,  True,  True,  True,  True,  True,  True,
        True,  True,  True,  True,  True,  True,  True,  True,  True,
        True,  True,  True,  True,  True,  True,  True,  True,  True,
        True,  True,  True,  True,  True,  True,  True,  True,  True,
        True,  True,  True,  True,  True,  True,  True,  True,  True,
        True,  True,  True,  True,  True,  True,  True,  True,  True,
        True,  True,  True,  True,  True,  True,  True,  True,  True,
        True,  True,  True,  True,  True,  True,  True,  True,  True,
        True,  True,  True,  True,  True,  True,  True,  True,  True,
        True, False, False, False, False, False, False, False, False,
       False, False, False, False, False, False, False, False, False,
       False, False, False,  True,  True,  True,  True,  True,  True,
       False, False, False, False, False, False, False, False, False,
       False, False, False, False, False, False, False, False, False,
       False, False, False, False, False, False, False, False, False,
       False, False, False, False, False, False, False, False, False,
       False, False, False, False, False, False, False, False, False,
       False, False, False, False, False, False, False, False, False,
       False, False, False, False, False, False, False, False, False,
       False, False, False, False, False, False, False, False, False,
       False, False])
An EventSeries object may also be created from a boolean array. Notably, this can be a more efficient way to store long boolean event time series data, because we capture only the transitions as Events.
my_bool_array = np.random.random(20) > .5
my_bool_array[-1] = my_bool_array[-2]  # make sure we have at least two contiguous timestamps at the end
print(f"As a raw boolean array: {my_bool_array}\n")
events2 = event_handling.EventSeries.from_bools(my_bool_array)
print(f"As an EventSeries object: {events2}")
As a raw boolean array: [False  True False False False False False  True False False  True  True
  True False False  True False False  True  True]

As an EventSeries object: [{'on': 1, 'off': 2}, {'on': 7, 'off': 8}, {'on': 10, 'off': 13}, {'on': 15, 'off': 16}, {'on': 18, 'off': 20}]
List operations
Because the EventSeries class inherits from the list class, it’s easy to perform list operations with Event objects.
print(len(events))
print(events[-1].duration)
last_event = events.pop()
print(events)
events.append(last_event)
print(events)
2
6
[{'on': 20, 'off': 100}]
[{'on': 20, 'off': 100}, {'on': 120, 'off': 126}]
The “resolve_events” functionality of the EventSeries class efficiently sorts and combines overlapping events within the same time series, ensuring there are no duplicates.
events.append(event_handling.Event(122, 127))
events.append(event_handling.Event(120, 123))
events.append(event_handling.Event(0,8))
events.append(event_handling.Event(20,30))
events.append(event_handling.Event(25,75))

print(f"After resolution: {events}")
After resolution: [{'on': 0, 'off': 8}, {'on': 20, 'off': 100}, {'on': 120, 'off': 127}]
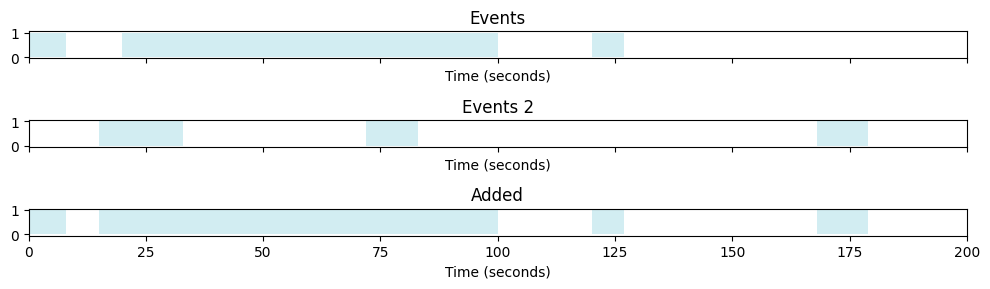
There are also some list functions available to us that work on two or more EventSeries objects
Below, we’ll simulate another EventSeries and combine it with our original one via the “+” list operator
def simulate_event_series(series_duration, event_count, event_max_length):
    bools = np.zeros(series_duration, dtype=bool)
    ons = np.random.randint(series_duration - event_max_length, size=event_count)
    durs = np.random.randint(event_max_length, size=event_count)
    for on, dur in zip(ons, durs):
        bools[on: on + dur] = True
    bools[-1] = bools[-2]  # make sure we have at least two contiguous timestamps at the end
    return event_handling.EventSeries.from_bools(bools)
fig, axs = plt.subplots(3, 1, figsize=(10,3), sharex=True)

plt.axes(axs[0])
events.plot()
plt.title("Events")

plt.axes(axs[1])

np.random.seed(2)

events2 = simulate_event_series(int(events.duration), 3, 20)
events2.plot()
plt.title("Events 2")

plt.axes(axs[2])
boolean_intersection = events + events2
boolean_intersection.plot()
plt.title("Added")

plt.tight_layout()
Logical operators
print(events)
print(events2)
[{'on': 0, 'off': 8}, {'on': 20, 'off': 100}, {'on': 120, 'off': 127}]
[{'on': 15, 'off': 33}, {'on': 72, 'off': 83}, {'on': 168, 'off': 179}]
events & events2
[{'on': 15, 'off': 100}]
events | events2
[{'on': 0, 'off': 8},
 {'on': 15, 'off': 100},
 {'on': 120, 'off': 127},
 {'on': 168, 'off': 179}]
events[0] == event_handling.Event(0, 8)
True
Statistics
By leveraging the aforementioned “overlaps” functionality of the Event class, we can start performing quantitative analytics directly on a pair of EventSeries objects. For instance, we can generate an agreement table between two EventSeries.
events.compute_agreement(events2, normalize=False)
| self | other | |
|---|---|---|
| self (ref) | 3 | 1 |
| other (ref) | 2 | 3 |
We can manipulate the Event tolerances to be much more strict…
tol = event_handling.OverlapTolerances(ratio_on=.1)
events.set_tolerances(tol)
events.compute_agreement(events2, normalize=False)
| self | other | |
|---|---|---|
| self (ref) | 3 | 1 |
| other (ref) | 1 | 3 |
We can generate an epoch-wise confusion matrix
events.epoch_confusion_matrix(events2, normalize=None)
| other (N) | other (P) | |
|---|---|---|
| self (N) | 89 | 16 |
| self (P) | 71 | 24 |
We can also generate an event-wise confusion matrix, although the TN is always 0, given that it’s difficult to define a truly-identified non-event:
events.event_confusion_matrix(events2, normalize=None)
| other (N) | other (P) | |
|---|---|---|
| self (N) | 0 | 1 |
| self (P) | 2 | 1 |
The Hypnogram class
The EventStack class enables handling of multiple contemporaneous EventSeries objects which pertain to different conditions. This is achieved by subclassing the ‘dict’ class.
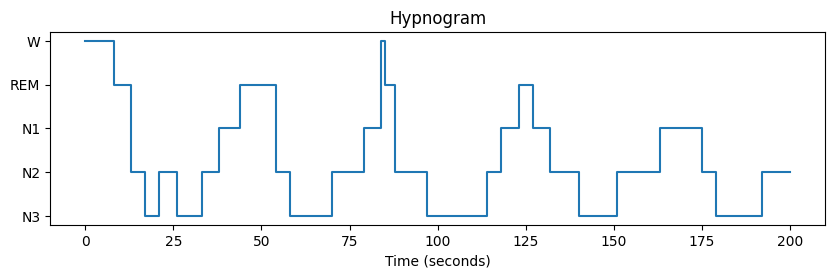
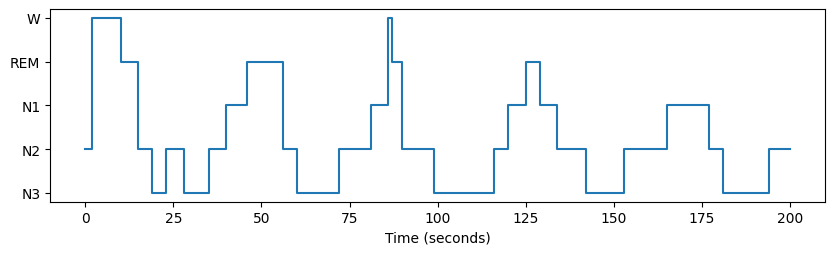
A good example of an EventStack is the Hypnogram:
from tests import utils
hypno = utils.simulate_hypnogram(series_duration=200, num_cycles=5, avg_duration=5, seed=3)
fig = hypno.plot()
plt.title("Hypnogram")
Text(0.5, 1.0, 'Hypnogram')
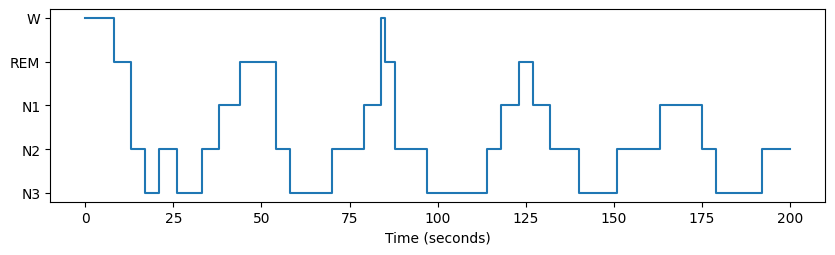
Now let’s compare two hypnograms
true = hypno.as_array()
pred = [hypnogram.SleepStages(c) for c in np.roll(true, 2)]
other = hypnogram.Hypnogram.from_array(pred)
fig = hypno.plot()
fig = other.plot()
On a per-epoch basis…
hypno.epoch_confusion_matrix(other)
| other (N3) | other (N2) | other (N1) | other (REM) | other (W) | |
|---|---|---|---|---|---|
| self (N3) | 52 | 12 | 0 | 0 | 0 |
| self (N2) | 12 | 50 | 4 | 6 | 0 |
| self (N1) | 0 | 8 | 23 | 2 | 0 |
| self (REM) | 0 | 0 | 5 | 14 | 3 |
| self (W) | 0 | 2 | 1 | 0 | 6 |
Or on a per-event basis…
tol = event_handling.OverlapTolerances(ratio_on=.2, ratio_off=.2)
hypno.set_tolerances(tol)
hypno.event_confusion_matrix(other)
| other (N3) | other (N2) | other (N1) | other (REM) | other (W) | |
|---|---|---|---|---|---|
| self (N3) | 4 | 2 | 0 | 0 | 0 |
| self (N2) | 0 | 2 | 0 | 1 | 0 |
| self (N1) | 0 | 0 | 1 | 0 | 0 |
| self (REM) | 0 | 0 | 0 | 1 | 1 |
| self (W) | 0 | 1 | 0 | 0 | 0 |